We Analyzed 100,046 Football Matches: Home Advantage Has Halved Since the 1990s
Everyone "knows" home advantage is real. Almost nobody has looked at what it has actually done over the last three decades. So we queried our own model database — 100,046 finished domestic league matches across ten European leagues, from August 1993 to May 2026 — and measured it directly. The headline: the gap between home wins and away wins has fallen from +23.5 percentage points in the 1990s to +11.9 today. Home advantage isn't dead. But it is, quite literally, half of what your instincts were trained on.
Method: exactly what we counted
This is the same database our betting models train on, so the hygiene rules are strict. Filters used for every number in this article:
Skip the hand-calculation.
Get real value bets flagged for you — 7-day free trial- Only matches with status = FINISHED and both final scores present — no scheduled, postponed or abandoned fixtures.
- Domestic leagues only (international tournaments and neutral-venue competitions excluded — the World Cup has no "home" team in the normal sense).
- Ten leagues: Premier League (n=13,271), Championship (n=17,839), La Liga (n=12,465), Serie A (n=11,935), Ligue 1 (n=12,382), Eredivisie (n=9,817), Primeira Liga (n=9,446), Bundesliga (n=5,579), 2. Bundesliga (n=4,900), 3. Liga (n=2,412). Total n=100,046.
- Seasons assigned by the July–June calendar (a match in February 2020 belongs to season 2019-20).
- The era-trend analysis uses only the seven leagues with full 1993–2026 coverage (the three German leagues enter our database in 2008/2019 and would distort a like-for-like comparison): a consistent panel of n=87,155.
- The database is deduplicated — a 2026 audit removed double-ingested rows before any of this was run.
The baseline: 45.6% home, 26.2% draw, 28.1% away
Across all 100,046 matches, the home team won 45.6%, drew 26.2% and lost 28.1%. Average goals per match: 2.69. That +17.5-point gap between home and away wins is the aggregate home advantage — but it hides enormous variation across leagues and, more importantly, across time.
League by league: who protects home turf best?
- Eredivisie — 47.3% home / 23.6% draw / 29.1% away (n=9,817). The strongest home-win rate, helped by the league's high scoring (3.06 goals/match) converting more games into decisive results.
- La Liga — 47.3% / 25.8% / 26.9% (n=12,465). Tied for the top home-win rate, with the biggest home-vs-away gap of any league: +20.4 points.
- Primeira Liga — 46.5% / 25.7% / 27.8% (n=9,446).
- Ligue 1 — 46.1% / 27.5% / 26.5% (n=12,382).
- Serie A — 45.4% / 27.2% / 27.4% (n=11,935).
- Premier League — 45.4% / 25.4% / 29.2% (n=13,271).
- Bundesliga — 44.6% / 24.6% / 30.8% (n=5,579, 2008 onwards).
- Championship — 44.4% / 27.5% / 28.1% (n=17,839, our single biggest sample).
- 2. Bundesliga — 43.3% / 27.8% / 28.9% (n=4,900, 2008 onwards).
- 3. Liga — 42.5% / 26.3% / 31.2% (n=2,412, 2019 onwards). The weakest home edge in the sample — though its coverage is entirely from the modern, low-home-advantage era, which brings us to the real story.
The real story: a 30-year slide
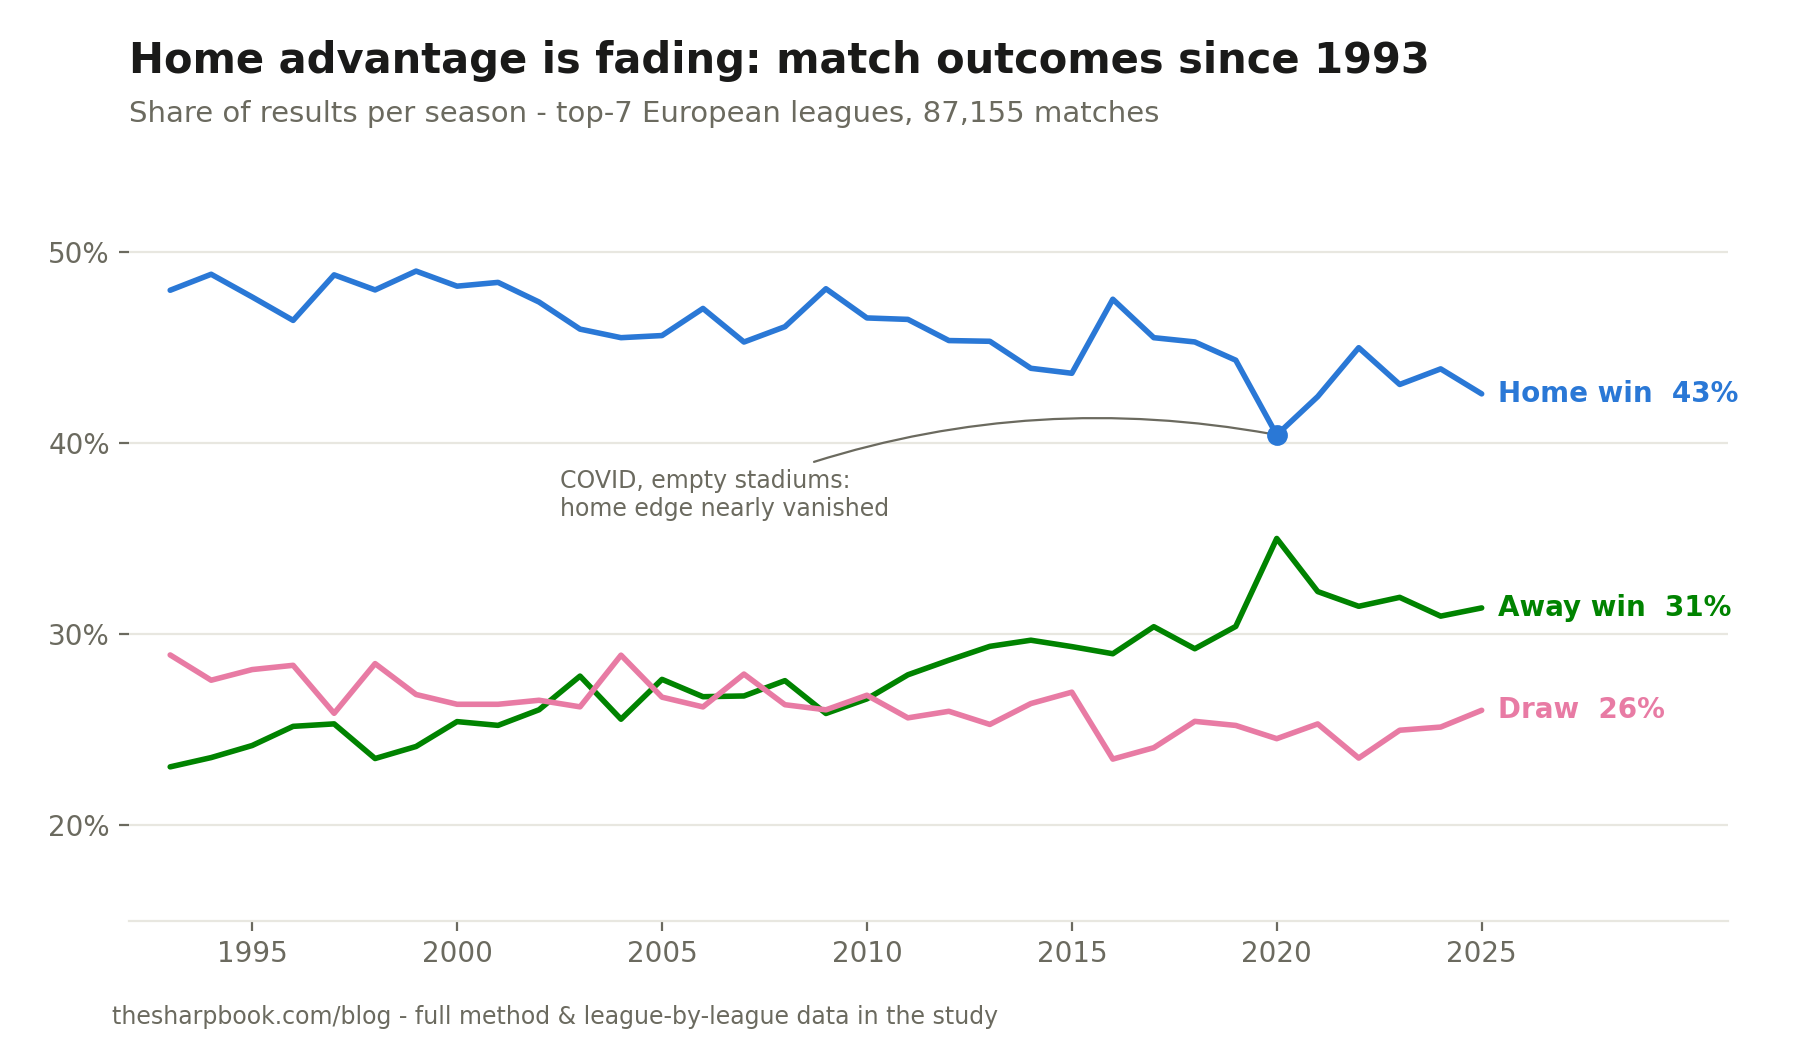
Take the seven leagues with unbroken 1993–2026 coverage (n=87,155) and split them into eras. The trend is relentless:
- 1993–2002: 48.1% home / 27.4% draw / 24.6% away — gap +23.5 points (n=26,132)
- 2003–2012: 46.2% / 26.7% / 27.1% — gap +19.1 (n=26,304)
- 2013–2019: 45.1% / 25.3% / 29.6% — gap +15.5 (n=18,392)
- 2020-21 (COVID): 40.4% / 24.5% / 35.0% — gap +5.4 (n=3,321)
- 2021–2025: 43.5% / 24.9% / 31.6% — gap +11.9 (n=13,006)
Every single era is weaker than the one before it, and the post-COVID rebound recovered only part of the pre-pandemic level. A bettor whose intuition was calibrated in the 1990s — or who reads books written then — is carrying a home-advantage prior roughly twice the current reality.
COVID: the season the crowd went missing
The 2020-21 season (plus the closed-door July 2020 restart rounds) is the cleanest natural experiment sports has ever produced: same teams, same stadiums, no fans. Across the seven-league panel, home wins fell to 40.4% and away wins surged to 35.0%. Two leagues actually inverted: in the Premier League away teams won 39.3% vs 39.0% for home teams (n=585), and in Ligue 1 it was 39.2% away vs 37.3% home (n=485). When the crowd left, most of the home edge left with it — strong evidence that crowd effects (including their documented influence on refereeing decisions) are a major component of home advantage, not just travel and familiarity.
Where home advantage fell hardest
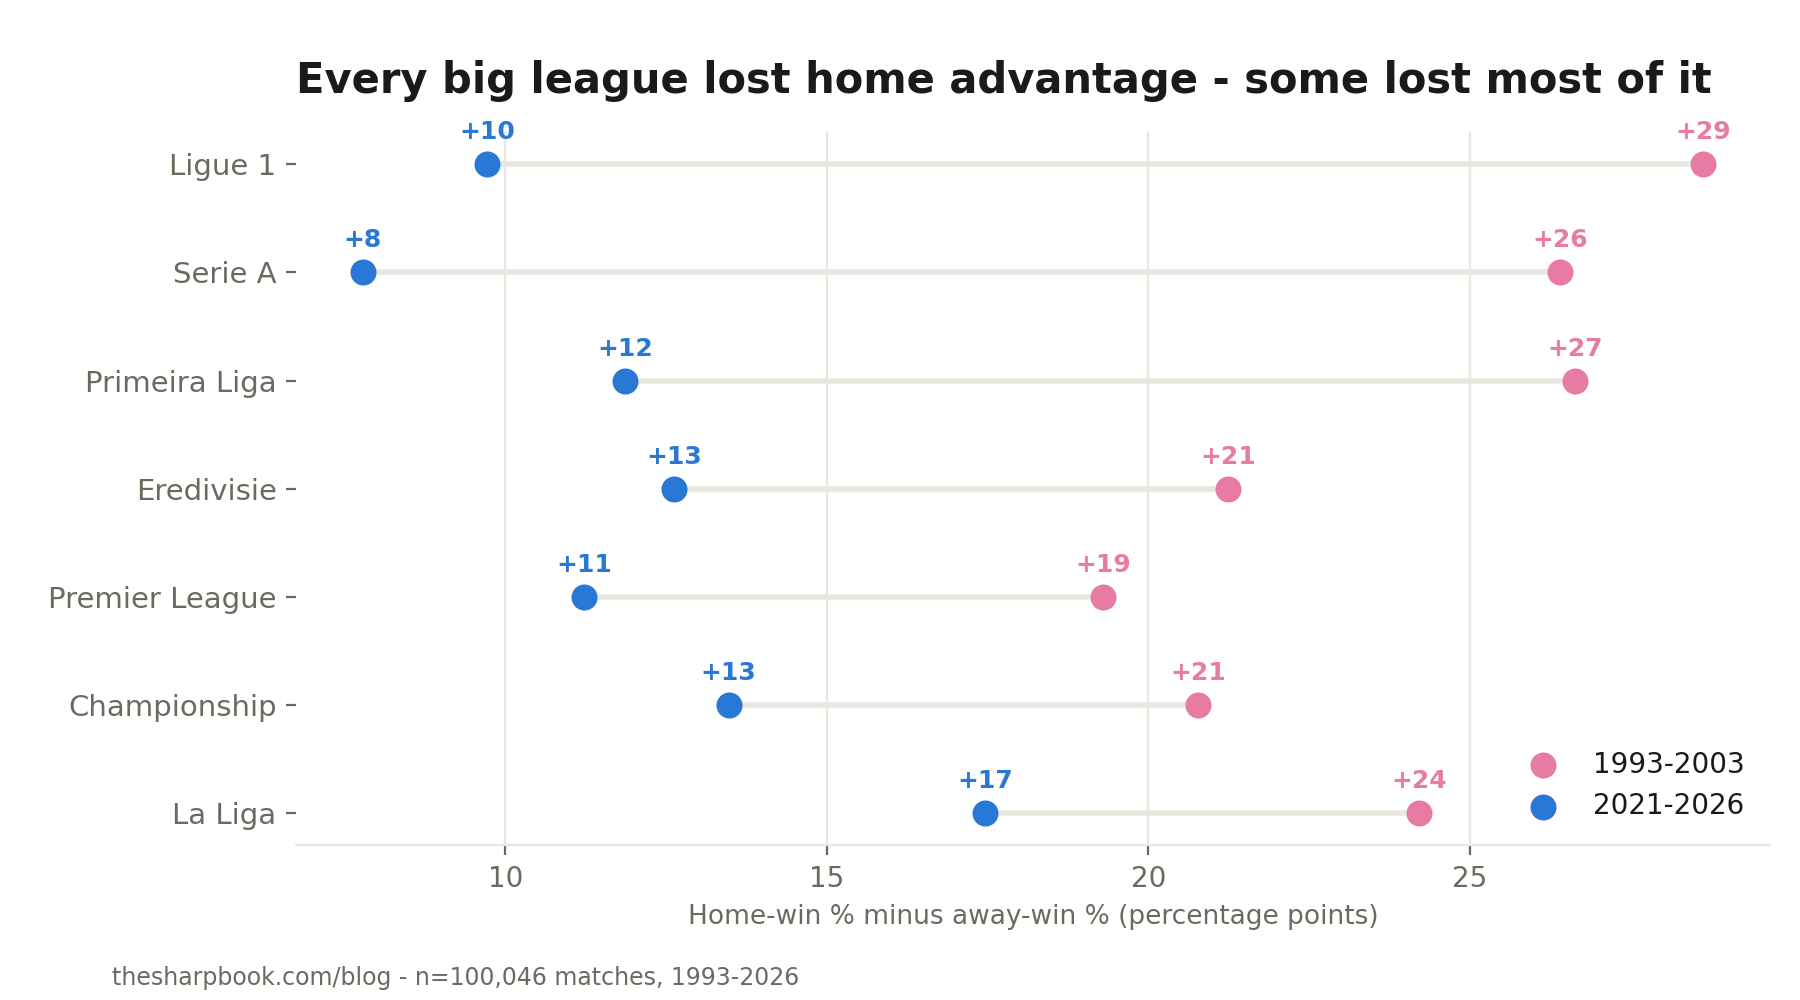
- Ligue 1: from a massive +28.6-point gap in 1993–2002 (49.9% home, 21.3% away) to just +9.7 in 2021–25 (43.1% vs 33.4%). The steepest structural decline in the sample.
- Serie A: home wins down from 48.6% to 40.8% — now the lowest home-win rate of any big-five league; the gap shrank from +26.4 to +7.8.
- Primeira Liga: +26.7 → +11.8 (home wins 50.2% → 43.5%).
- Premier League: +19.3 → +11.2 (45.9% → 43.9% home) — a decline, but one of the mildest among the big five.
- Eredivisie: +21.3 → +12.7 — the best-preserved home fortress in the panel.
How football compares to US sports
Our database also settles the cross-sport question with matching methodology (finished games, final scores, no ties possible in these sports): NBA home teams win 56.4% (n=13,370, 2015–2026), NHL 53.7% (n=10,429, 2017–2026), MLB 53.2% (n=20,792, 2017–2026). Football looks lower because of draws — but restrict to decided matches and the home team took 66.2% of them in 1993–2002 and takes 57.9% today. In other words, modern football's home edge in decided games now sits between the NBA's and the NHL's, when thirty years ago it towered over every US league.
Download the data
The full per-league, per-season table behind this study — league, season, matches, home/draw/away shares across all 100,046 matches — is available as a CSV: Download CSV. The data is free to reuse for any purpose, including commercially — all we ask is a link back to this page as the source.
Honest limitations
- Results only, no odds. Our historical database stores scores, not bookmaker prices, so this study says nothing about whether any of this is profitable — bookmakers watch the same trend and have repriced accordingly. A declining home advantage is not a betting edge; it is a fact your priors need to absorb.
- The COVID bucket is approximate. Our July–June season split assigns the closed-door July 2020 restart matches to the 2020 bucket alongside the 2020-21 season. Nearly all of those matches were behind closed doors, but the bucket is not a laboratory-pure sample.
- Uneven league coverage. The German leagues enter in 2008 (Bundesliga, 2. Bundesliga) and 2019 (3. Liga) — that is why the era analysis uses the seven-league panel. The in-progress 2025-26 season is only partially ingested for some leagues and barely moves any aggregate.
- League composition changes. Promotion, relegation and format changes mean the "Premier League" of 1993 is not the same set of clubs as 2025. We measure the league as an institution, not a fixed panel of teams.
What we do with this
Our football model doesn't use a folklore home bonus — home advantage is an explicit, measured parameter validated against this exact database, and it is set to zero at neutral venues, where the data says it belongs. If you want to see how the model performs with honestly-calibrated home advantage baked in, our full bet history is public on the track record page — every settled bet, wins and losses alike.