Which League Is Really the Draw League? What 100,046 Matches Say About Draws and Goals
Ask any bettor which league is "the draw league" and you'll get a confident answer — usually Serie A or Ligue 1, based on a reputation formed sometime around 2005. We checked, against our own model database: 100,046 finished domestic league matches across ten European leagues, 1993 to 2026. The reputation is out of date. The league that defined defensive stalemates has transformed into one of Europe's highest-scoring competitions, draws are in slow structural decline everywhere, and goals per game are near a 30-year high. Here are the actual numbers.
Method: exactly what we counted
- Only matches with status = FINISHED and both final scores present; domestic leagues only (international tournaments excluded).
- Ten leagues, total n=100,046: Premier League (13,271), Championship (17,839), La Liga (12,465), Serie A (11,935), Ligue 1 (12,382), Eredivisie (9,817), Primeira Liga (9,446), Bundesliga (5,579, from 2008), 2. Bundesliga (4,900, from 2008), 3. Liga (2,412, from 2019).
- Seasons assigned by the July–June calendar; era trends use the seven leagues with full 1993–2026 coverage (n=87,155) so no league drifts in or out of the comparison.
- "Draw rate" = share of matches ending level; "over 2.5" = share with 3+ total goals; deduplicated database (2026 audit).
The all-time draw table, 1993–2026
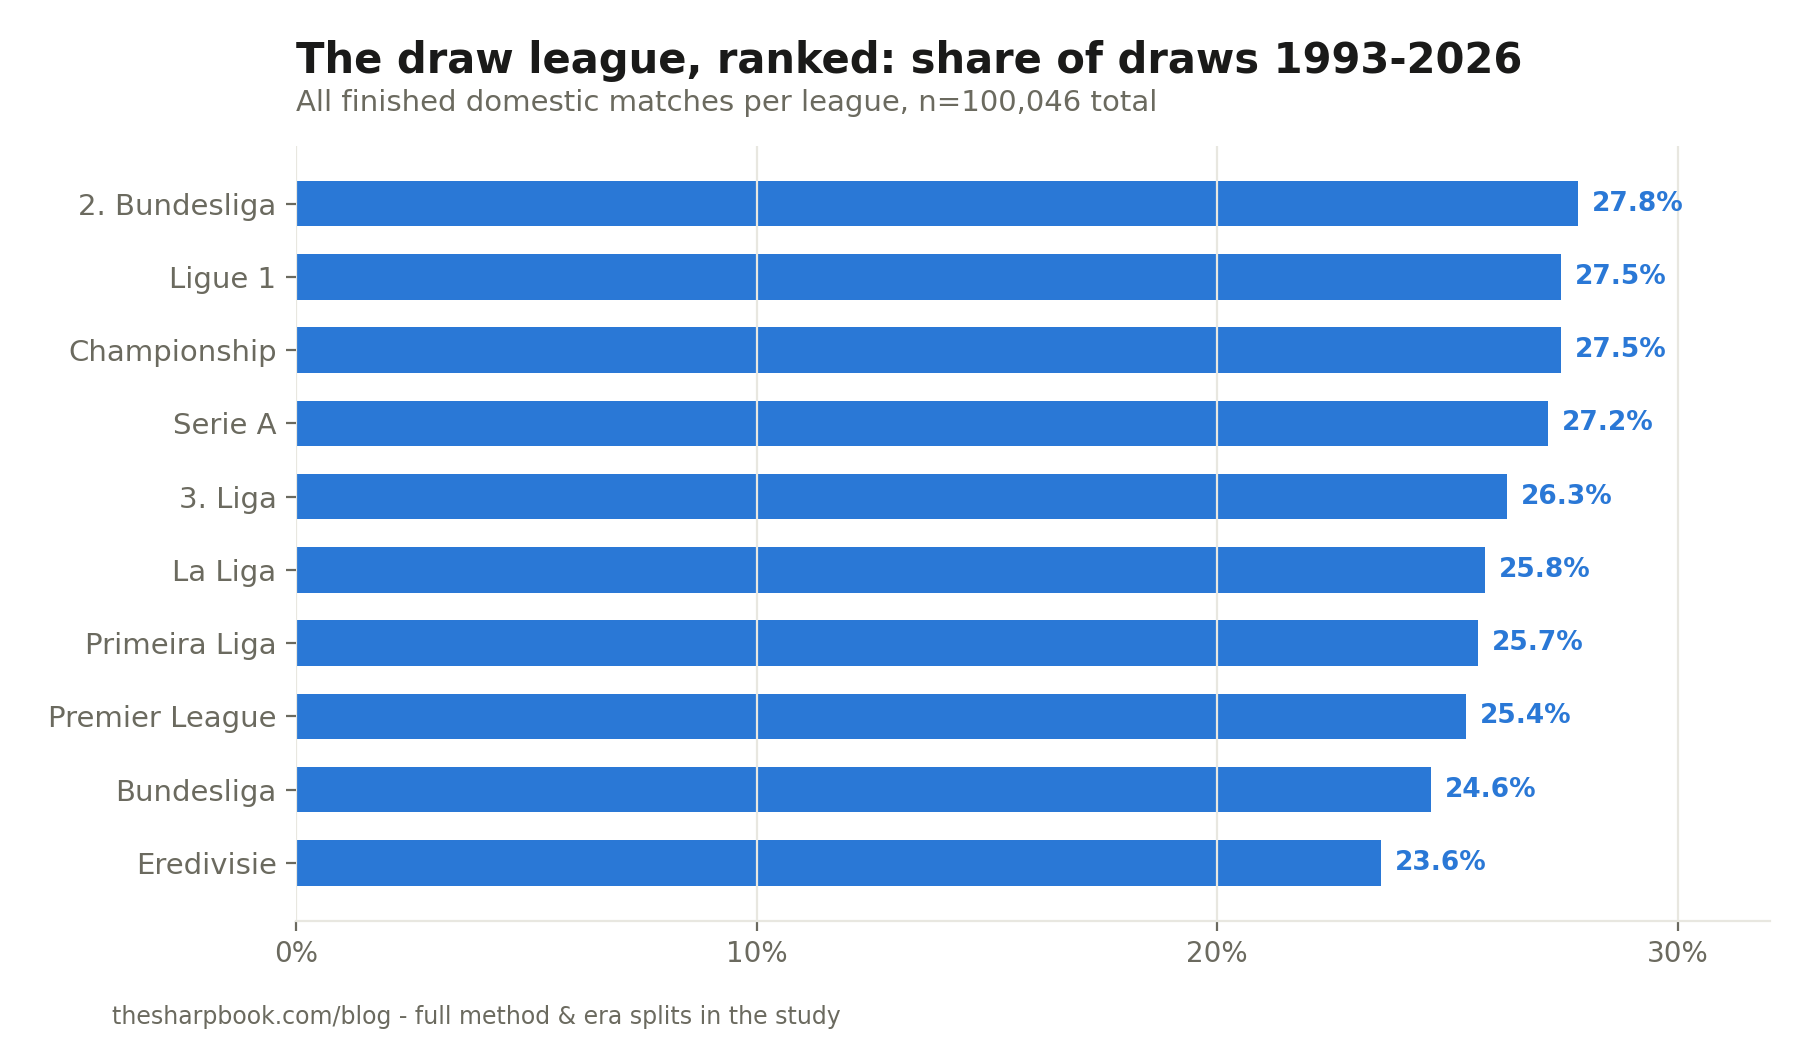
Across all 100,046 matches, 26.2% ended level. By league:
Skip the hand-calculation.
Get real value bets flagged for you — 7-day free trial- 2. Bundesliga — 27.8% draws (n=4,900, 2008 onwards): the actual all-time draw king in our data, though on the shortest big-sample history.
- Ligue 1 — 27.5% (n=12,382) and Championship — 27.5% (n=17,839): the classic grinders, tied.
- Serie A — 27.2% (n=11,935): third among the big five — the catenaccio reputation slightly outruns the data.
- 3. Liga — 26.3% (n=2,412).
- La Liga — 25.8% (n=12,465), Primeira Liga — 25.7% (n=9,446), Premier League — 25.4% (n=13,271).
- Bundesliga — 24.6% (n=5,579).
- Eredivisie — 23.6% (n=9,817): the anti-draw league, a full 4 points below the leaders.
The Ligue 1 transformation: the draw league that stopped drawing
The single most dramatic shift in the whole dataset is France. In 2003–2012, Ligue 1 was everything its reputation promised: 29.9% draws, an absurd 11.2% goalless 0-0s (one in nine matches!), and just 2.32 goals per game — the lowest-scoring league-era in our sample. In 2020–2025 the same league runs 23.4% draws, 6.4% 0-0s and 2.87 goals per game, with 55.0% of matches clearing 2.5 goals (up from 40.9%). France went from the most draw-prone big-five league to one of its most open in barely a decade. If your mental model of Ligue 1 was formed in the Lyon-dynasty years, it is measurably wrong.
Who's the draw league right now? In the 2020–2025 era it's La Liga at 26.6%, followed by the Championship and Serie A at 25.8% — while the two "classic" draw leagues, Ligue 1 (23.4%) and the Premier League (23.0%), now sit at the bottom of the table.
Draws are in slow, steady decline
Across the seven-league panel (n=87,155), the draw rate has fallen era over era: 27.4% (1993–2002) → 26.7% (2003–2012) → 25.3% (2013–2019) → 24.9% (2021–2025). Season-level extremes across the full dataset tell the same story: 1993-94 and 2004-05 both hit 28.9%, while 2022-23 bottomed at 23.5%. It's not a collapse — the draw is not "dying" — but roughly one draw in ten has quietly turned into a decisive result over thirty years.
Goals per game: a 30-year high
The mirror image of the shrinking draw is rising scoring. Season by season across the full ten-league dataset, goals per match bottomed out at 2.46 in 2005-06 and 2.51 in 2004-05 — the defensive mid-2000s peak — then climbed almost monotonically to 2.90 in 2023-24 and 2.91 in 2025-26 (partial season). League by league, comparing 1993–2002 with 2020–2025:
- Premier League: 2.62 → 2.93 goals per game; 0-0s down from 8.8% to 5.5%; over-2.5 rate up from 47.8% to 56.3%.
- Ligue 1: 2.36 → 2.87 — the biggest scoring gain in the sample.
- Eredivisie: 3.05 → 3.03, steady at the top — over 2.5 goals in 58.3% of matches, the highest in our long-history panel in every era (only the Bundesliga, which enters our data in 2008, runs higher today at 60.6%, n=1,905 since 2020).
- Serie A: 2.62 → 2.75; 0-0s down from 9.2% to 6.2%.
- Championship: 2.60 → 2.49 — the outlier grinding the other way, with the lowest over-2.5 rate in the panel at 46.0%.
- La Liga: 2.66 → 2.57, over-2.5 down to 46.3% — the lowest of the big five, a striking counter-trend for a league marketed on attacking football.
Why are goals rising? Our data shows the what, not the why — but the timing lines up with the pressing era, rule tweaks that favour attackers (back-pass enforcement, offside interpretation, added time), and pitch-quality and squad-depth gains that reward front-foot football. The Championship and La Liga prove it isn't a law of nature: league style still dominates.
Download the data
The per-league, per-season table behind this study — league, season, matches, draw rate, 0-0 rate and goals per match across all 100,046 matches — is available as a CSV: Download CSV. The data is free to reuse for any purpose, including commercially — all we ask is a link back to this page as the source.
Honest limitations
- Results only, no odds. This study describes match outcomes, not betting value. Bookmakers price draw rates and totals from the same public results — a league drawing often is not a reason to bet draws, because the odds already say so.
- Era buckets smooth over season noise. Single seasons swing several points around these averages; the buckets (10, 10, 7 and 6 seasons) are chosen for sample size, not narrative convenience.
- Uneven coverage. German leagues enter in 2008/2019, so they appear in the all-time table but not the era panel. The in-progress 2025-26 season is only partially ingested for some leagues.
- The 2020–25 bucket includes the COVID season — empty stadiums measurably changed results (see our home-advantage study), though draw and goal rates moved far less than home-win rates did.
What we do with this
These base rates are the floor our football model builds on — a Poisson goal model whose features carry each league's own scoring environment, so an Eredivisie total and a Championship total are never priced from the same scoring assumption. Every bet the model has ever surfaced is public, settled and graded on the track record page.